Visualizations
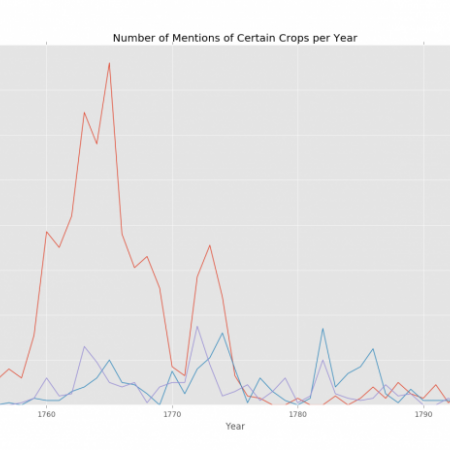
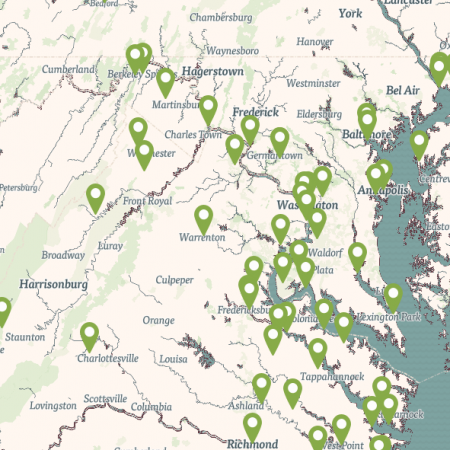
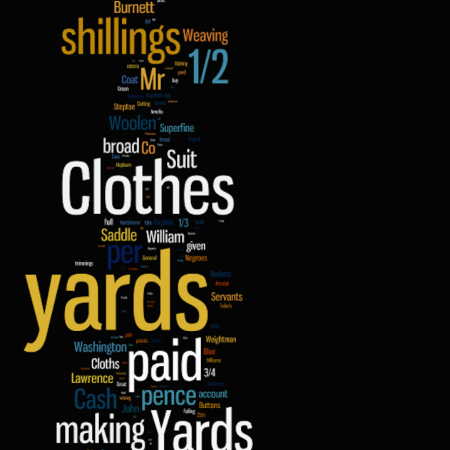
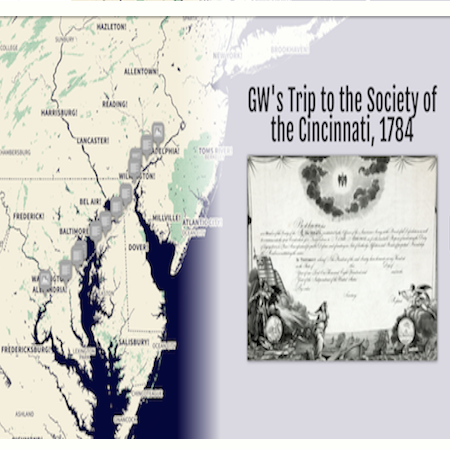
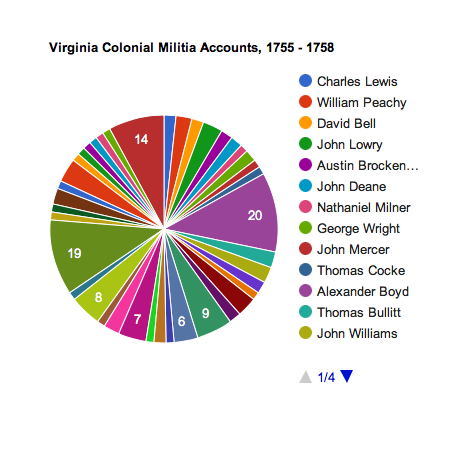
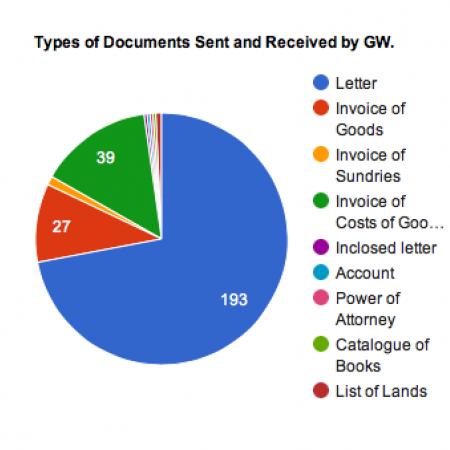
The work done at the Financial Papers Project has allowed us to spend time exploring, experimenting with, and developing additional tools and resources. The results include word clouds and an interactive quiz—both help illuminate the various types of material present within these documents. The interactive pie charts and a story map provide insight into some of the accounts not currently available on this site. New visualizations and interactive material will continue to be added in order to continue to highlight various aspects of the content and what can be learned.
